

OVERVIEW
Our team was tasked with designing an analytics dashboard for web or application. Our assignment was to create a health monitor or an E-commerce analytics dashboard with careful consideration of the filters, chart types, and the core features the users would need most.
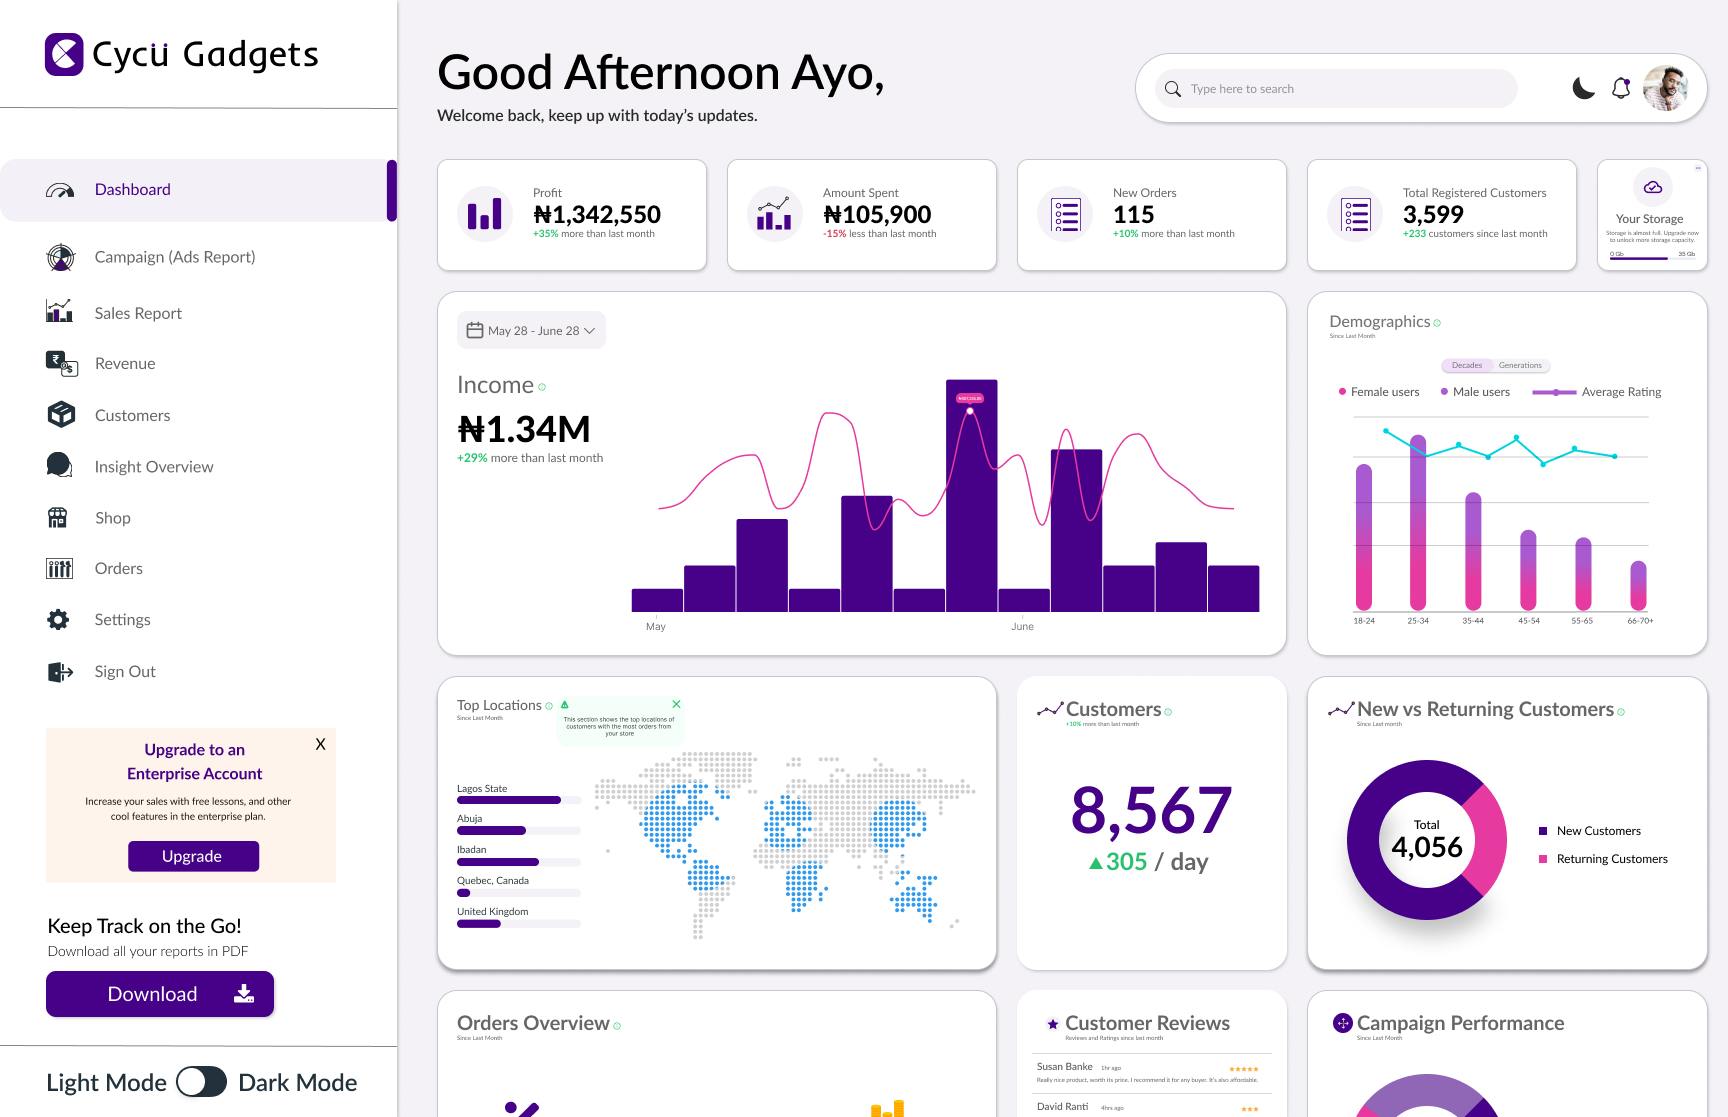
After a brainstorming session in our team, we decided to design an E-commerce dashboard specifically for a gadget company (CYCU gadgets)
TEAM
The combined efforts of every product designers in fortune vaults (UI and UX). The design process was divided among product designers in the team, some on UI while others on UX.
RESEARCH
Our team primarily focused on qualitative research for this project, our research was based majorly online, here we reviewed previous works, then we generated new ideas based on previously documented research activities from our online sources.
STRATEGY
BRAINSTORMING
We had several brainstorming sessions, where we were able to gather various dashboard designs, decided the features that would be needed on our dashboard design.
DESIGN
The UI design was carried out using Figma. We went through the process of ideation, and creating a style guide that would be appropriate for a user centric design and aesthetically pleasing design. We then went on to create low fidelity wireframes, and then high fidelity wireframes using the style guides.
WIREFRAMES
We developed the wireframes for our dashboard designs and the features to be included.
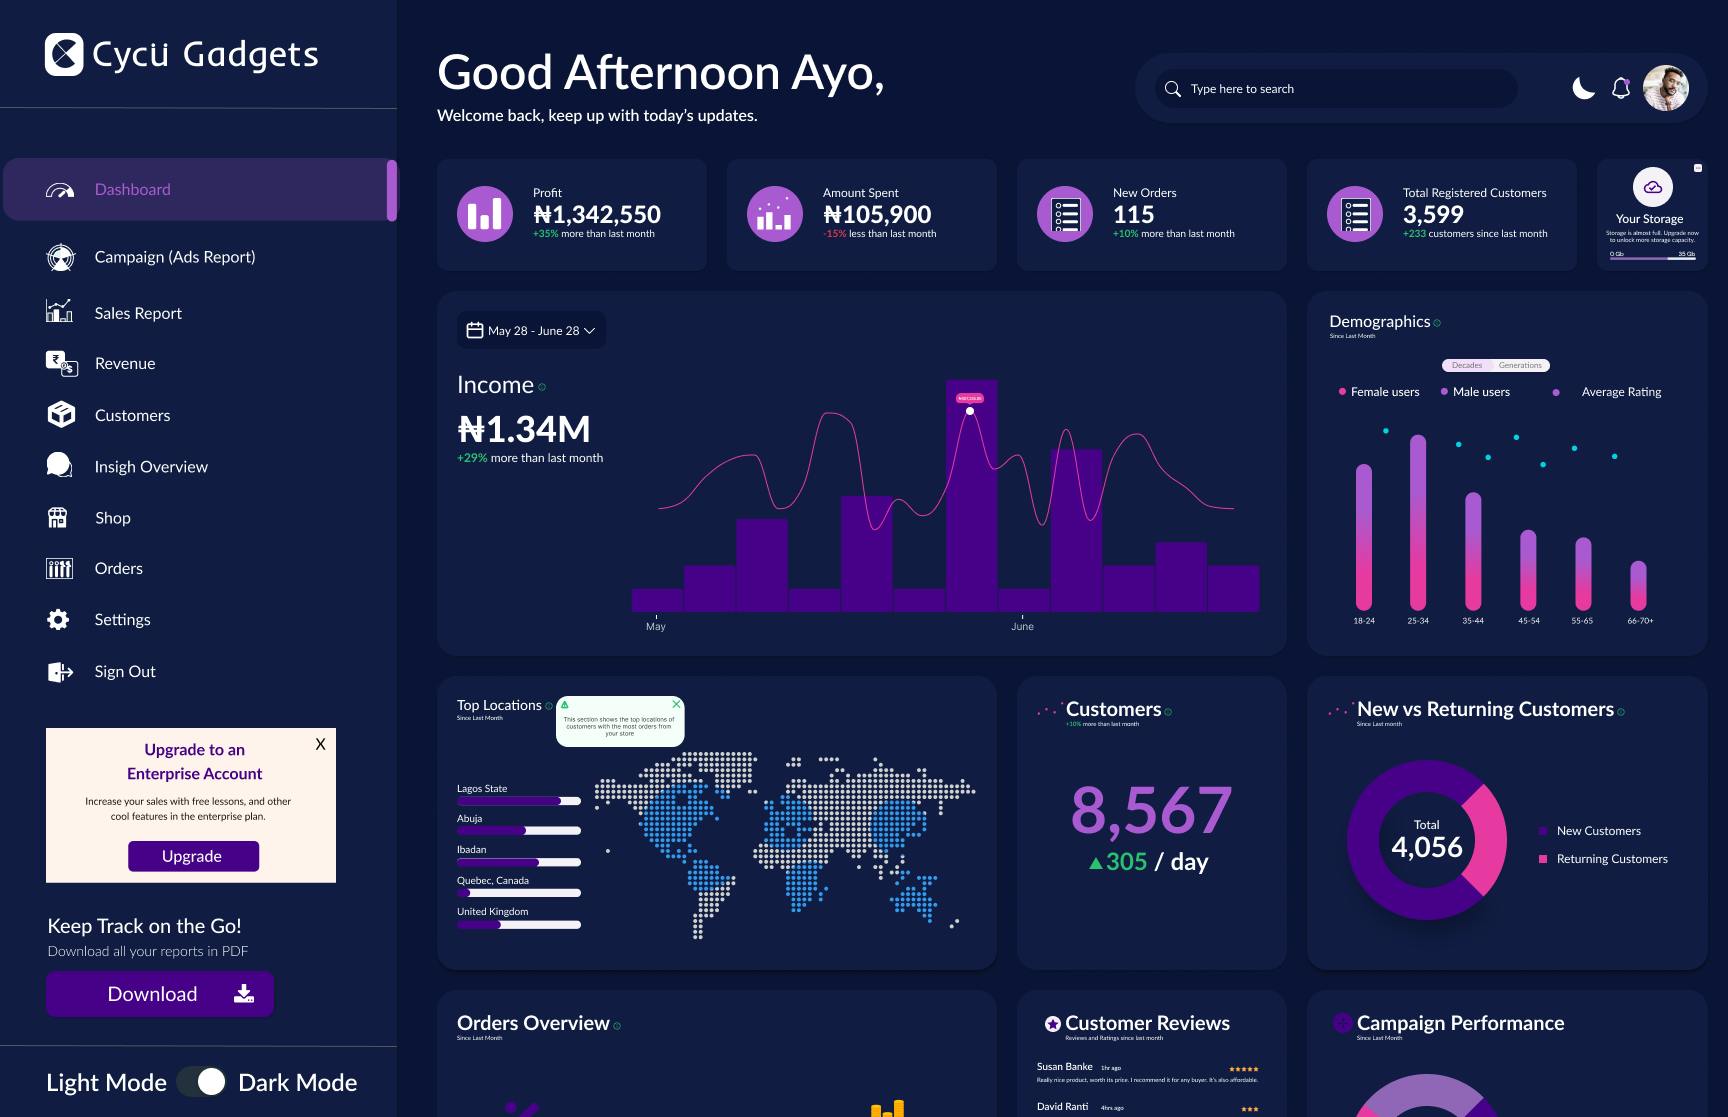
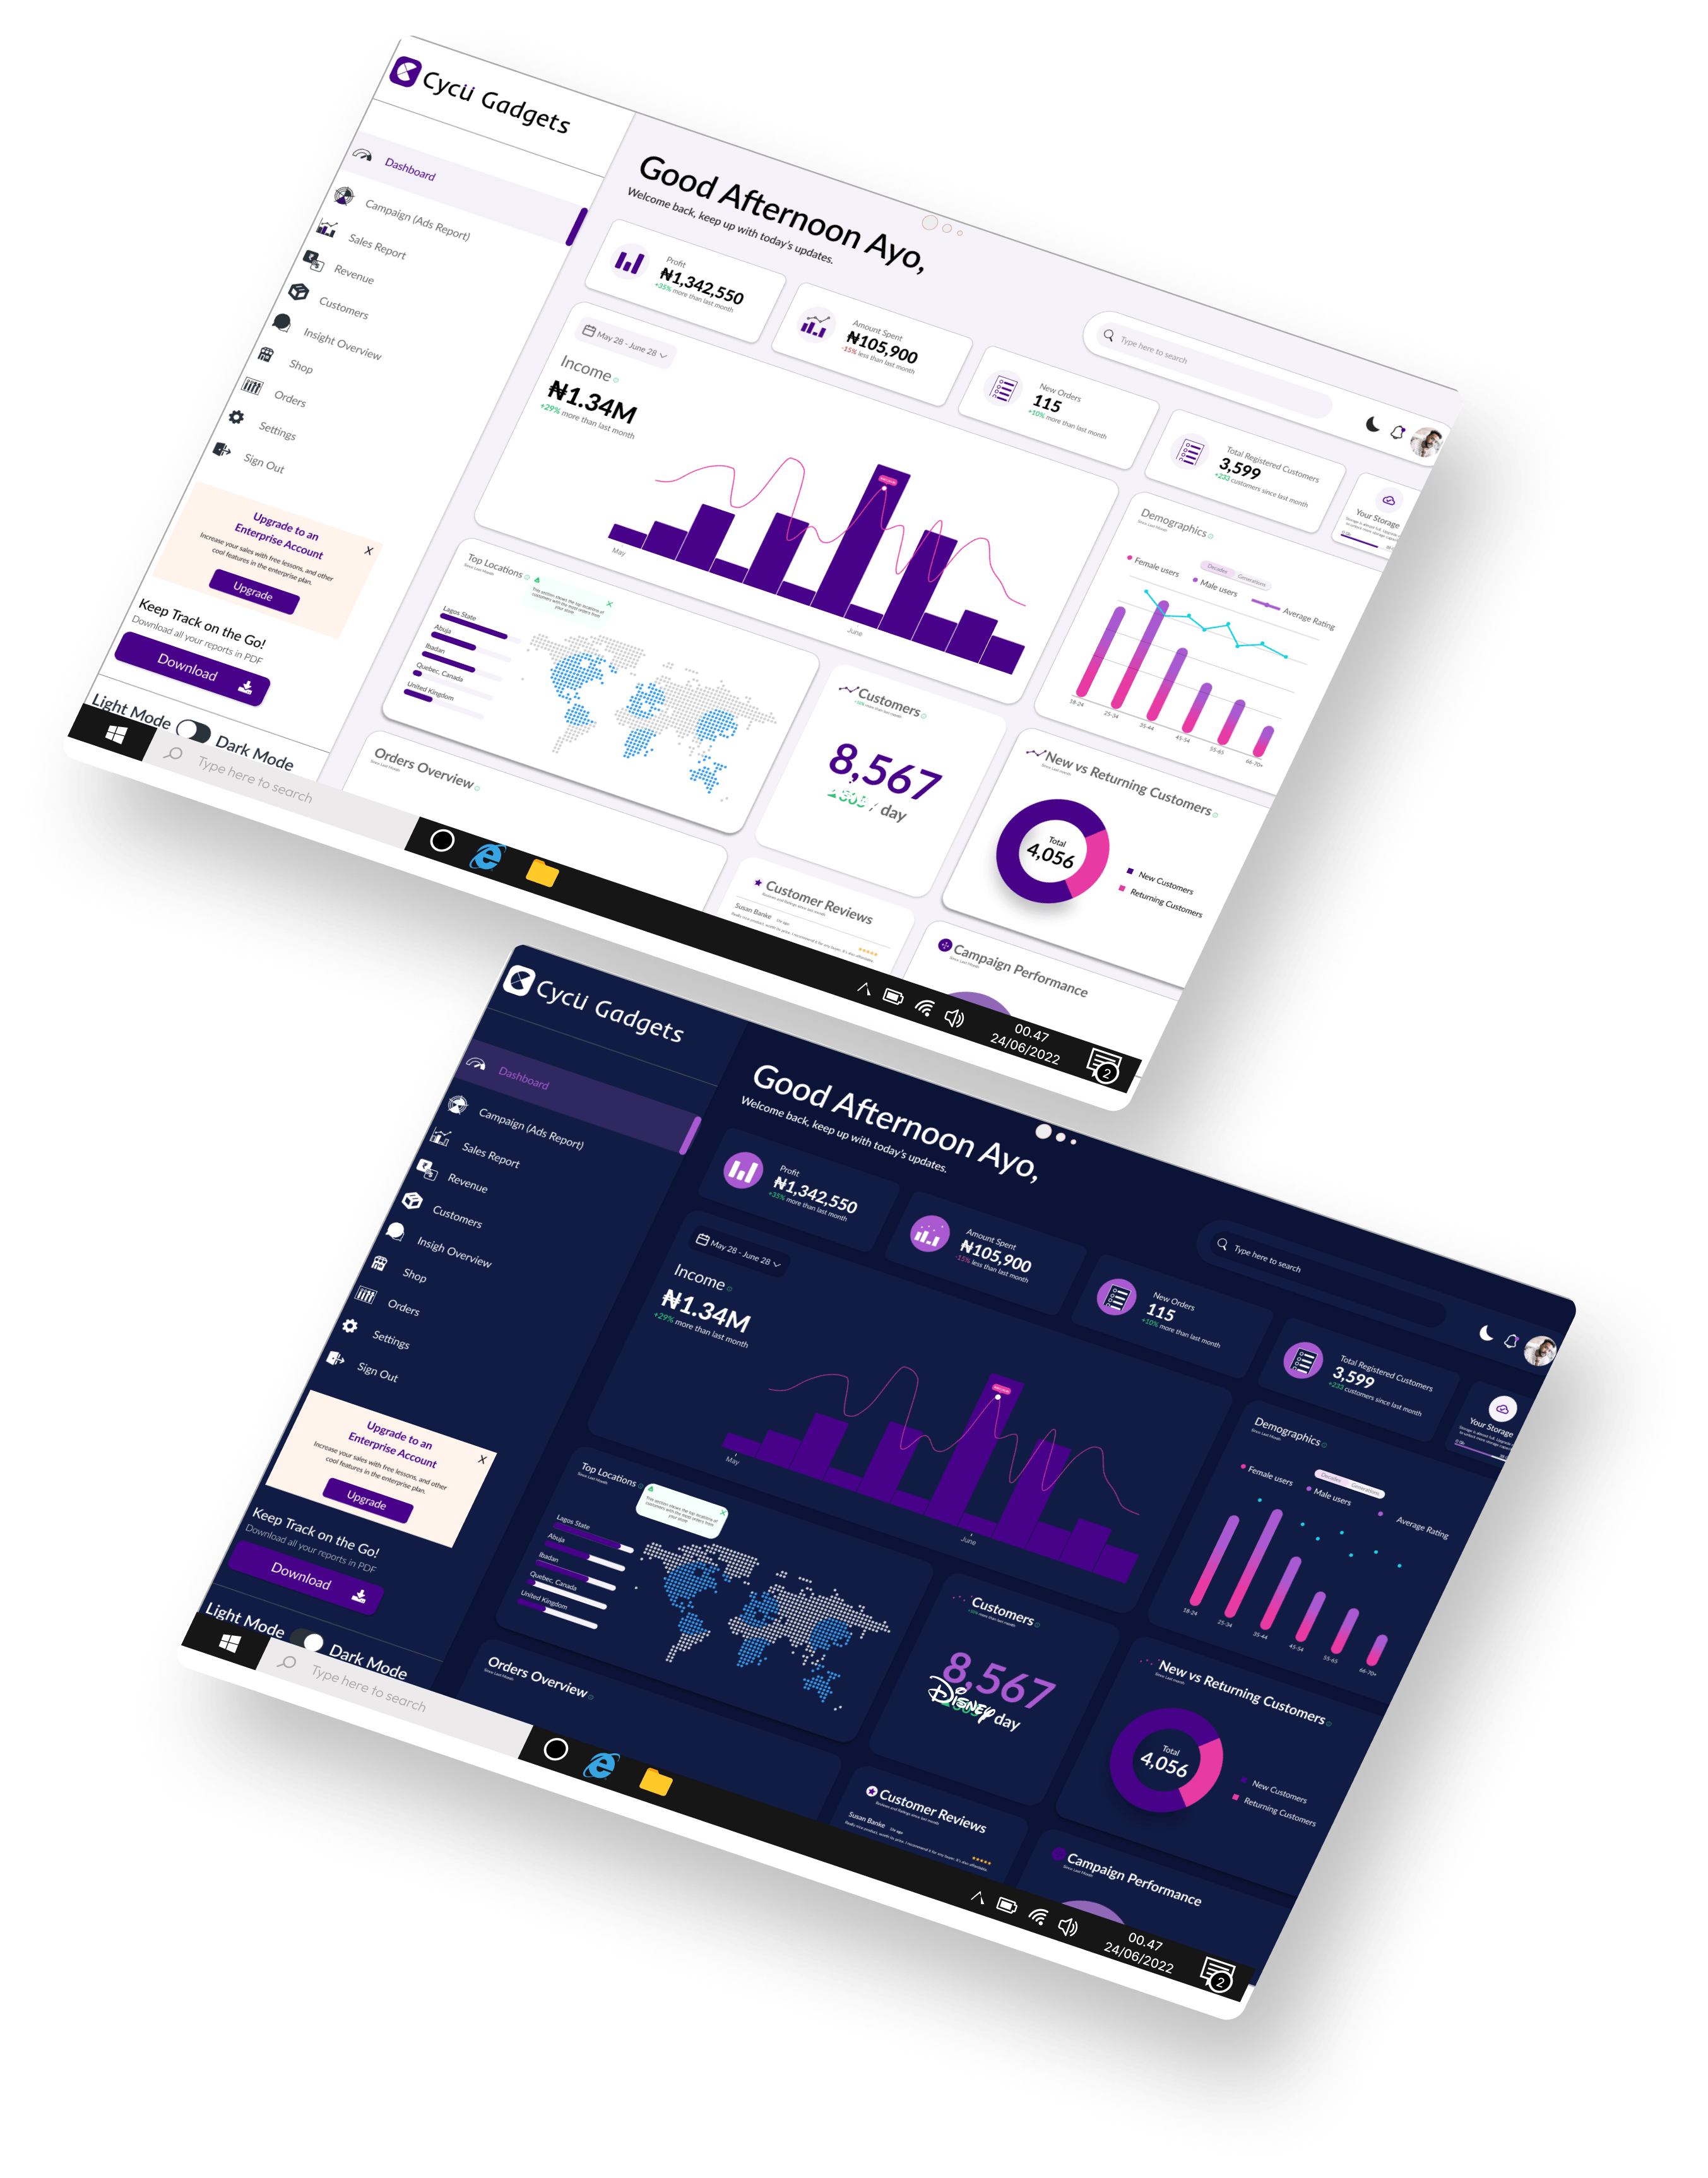
DARK MODE
Dark UI’s are dramatic, stylish, elegant and it compliments luxury. A black background design reinforces striking visuals, introduces a sense of mystery, has better contrast, and supports visual hierarchy. The Dark UI places value on users’ health and wellbeing.
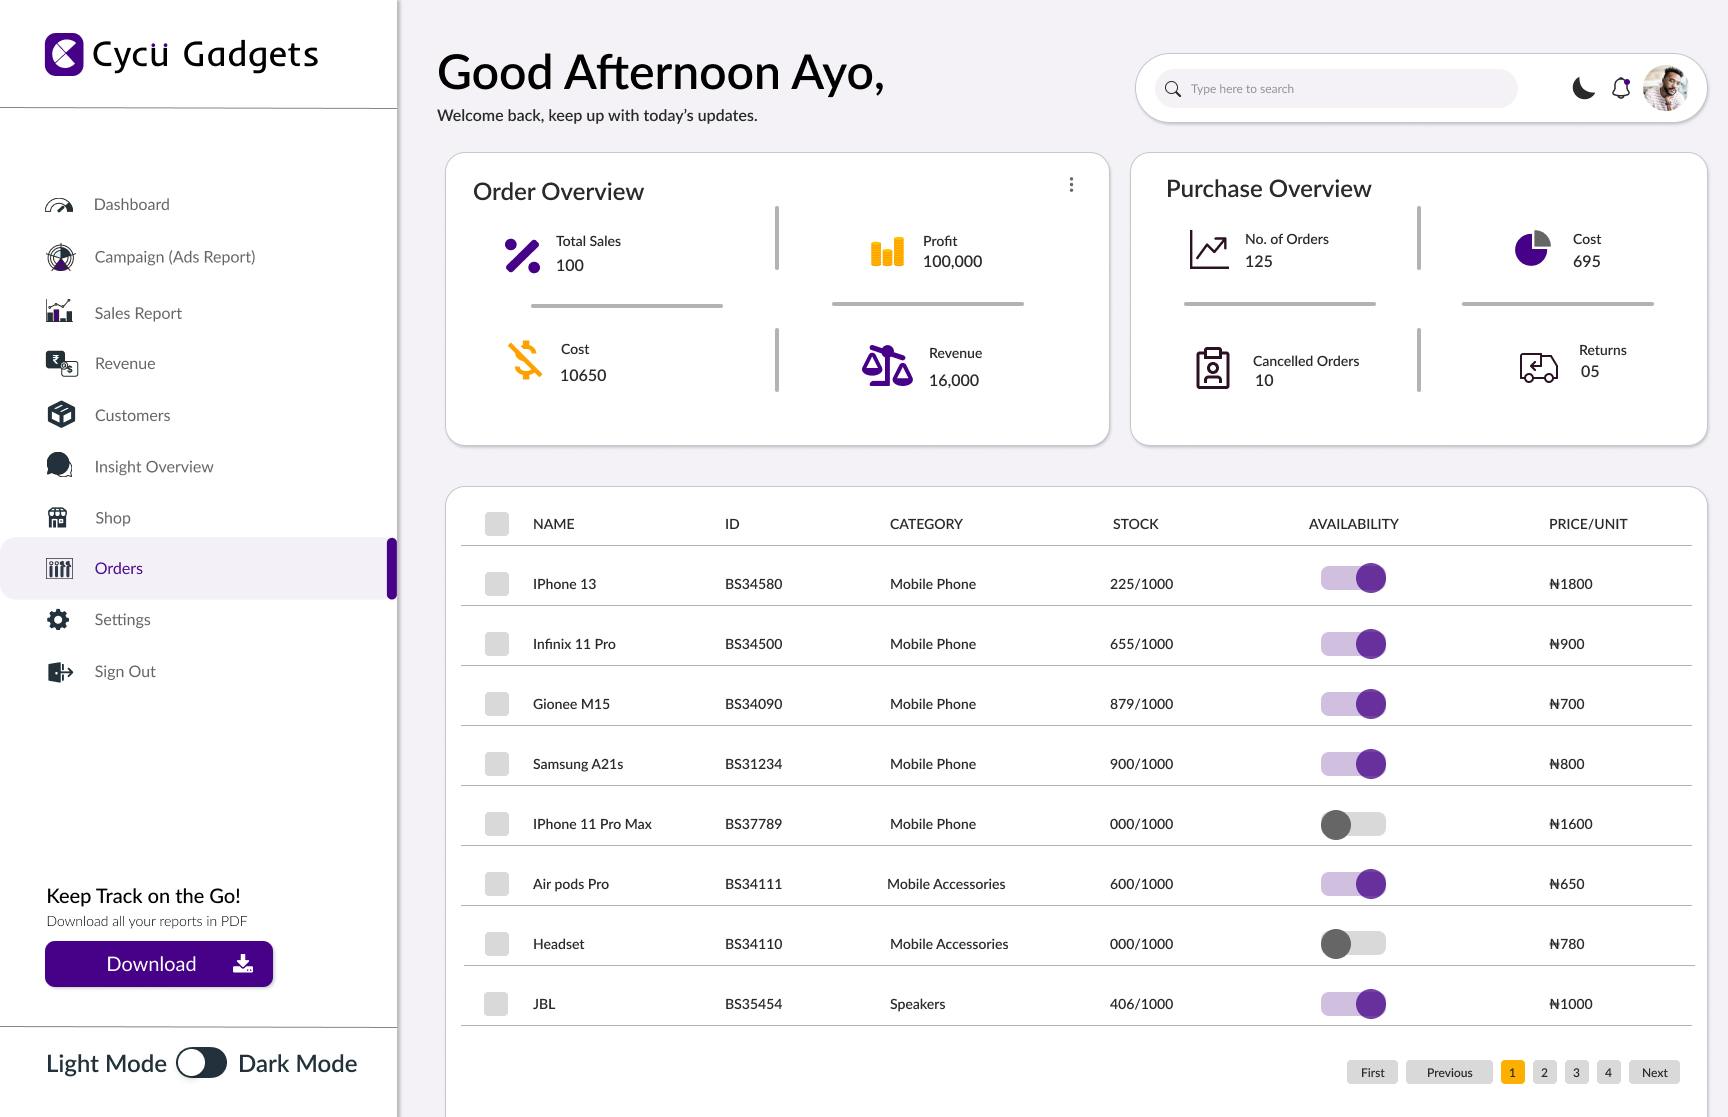
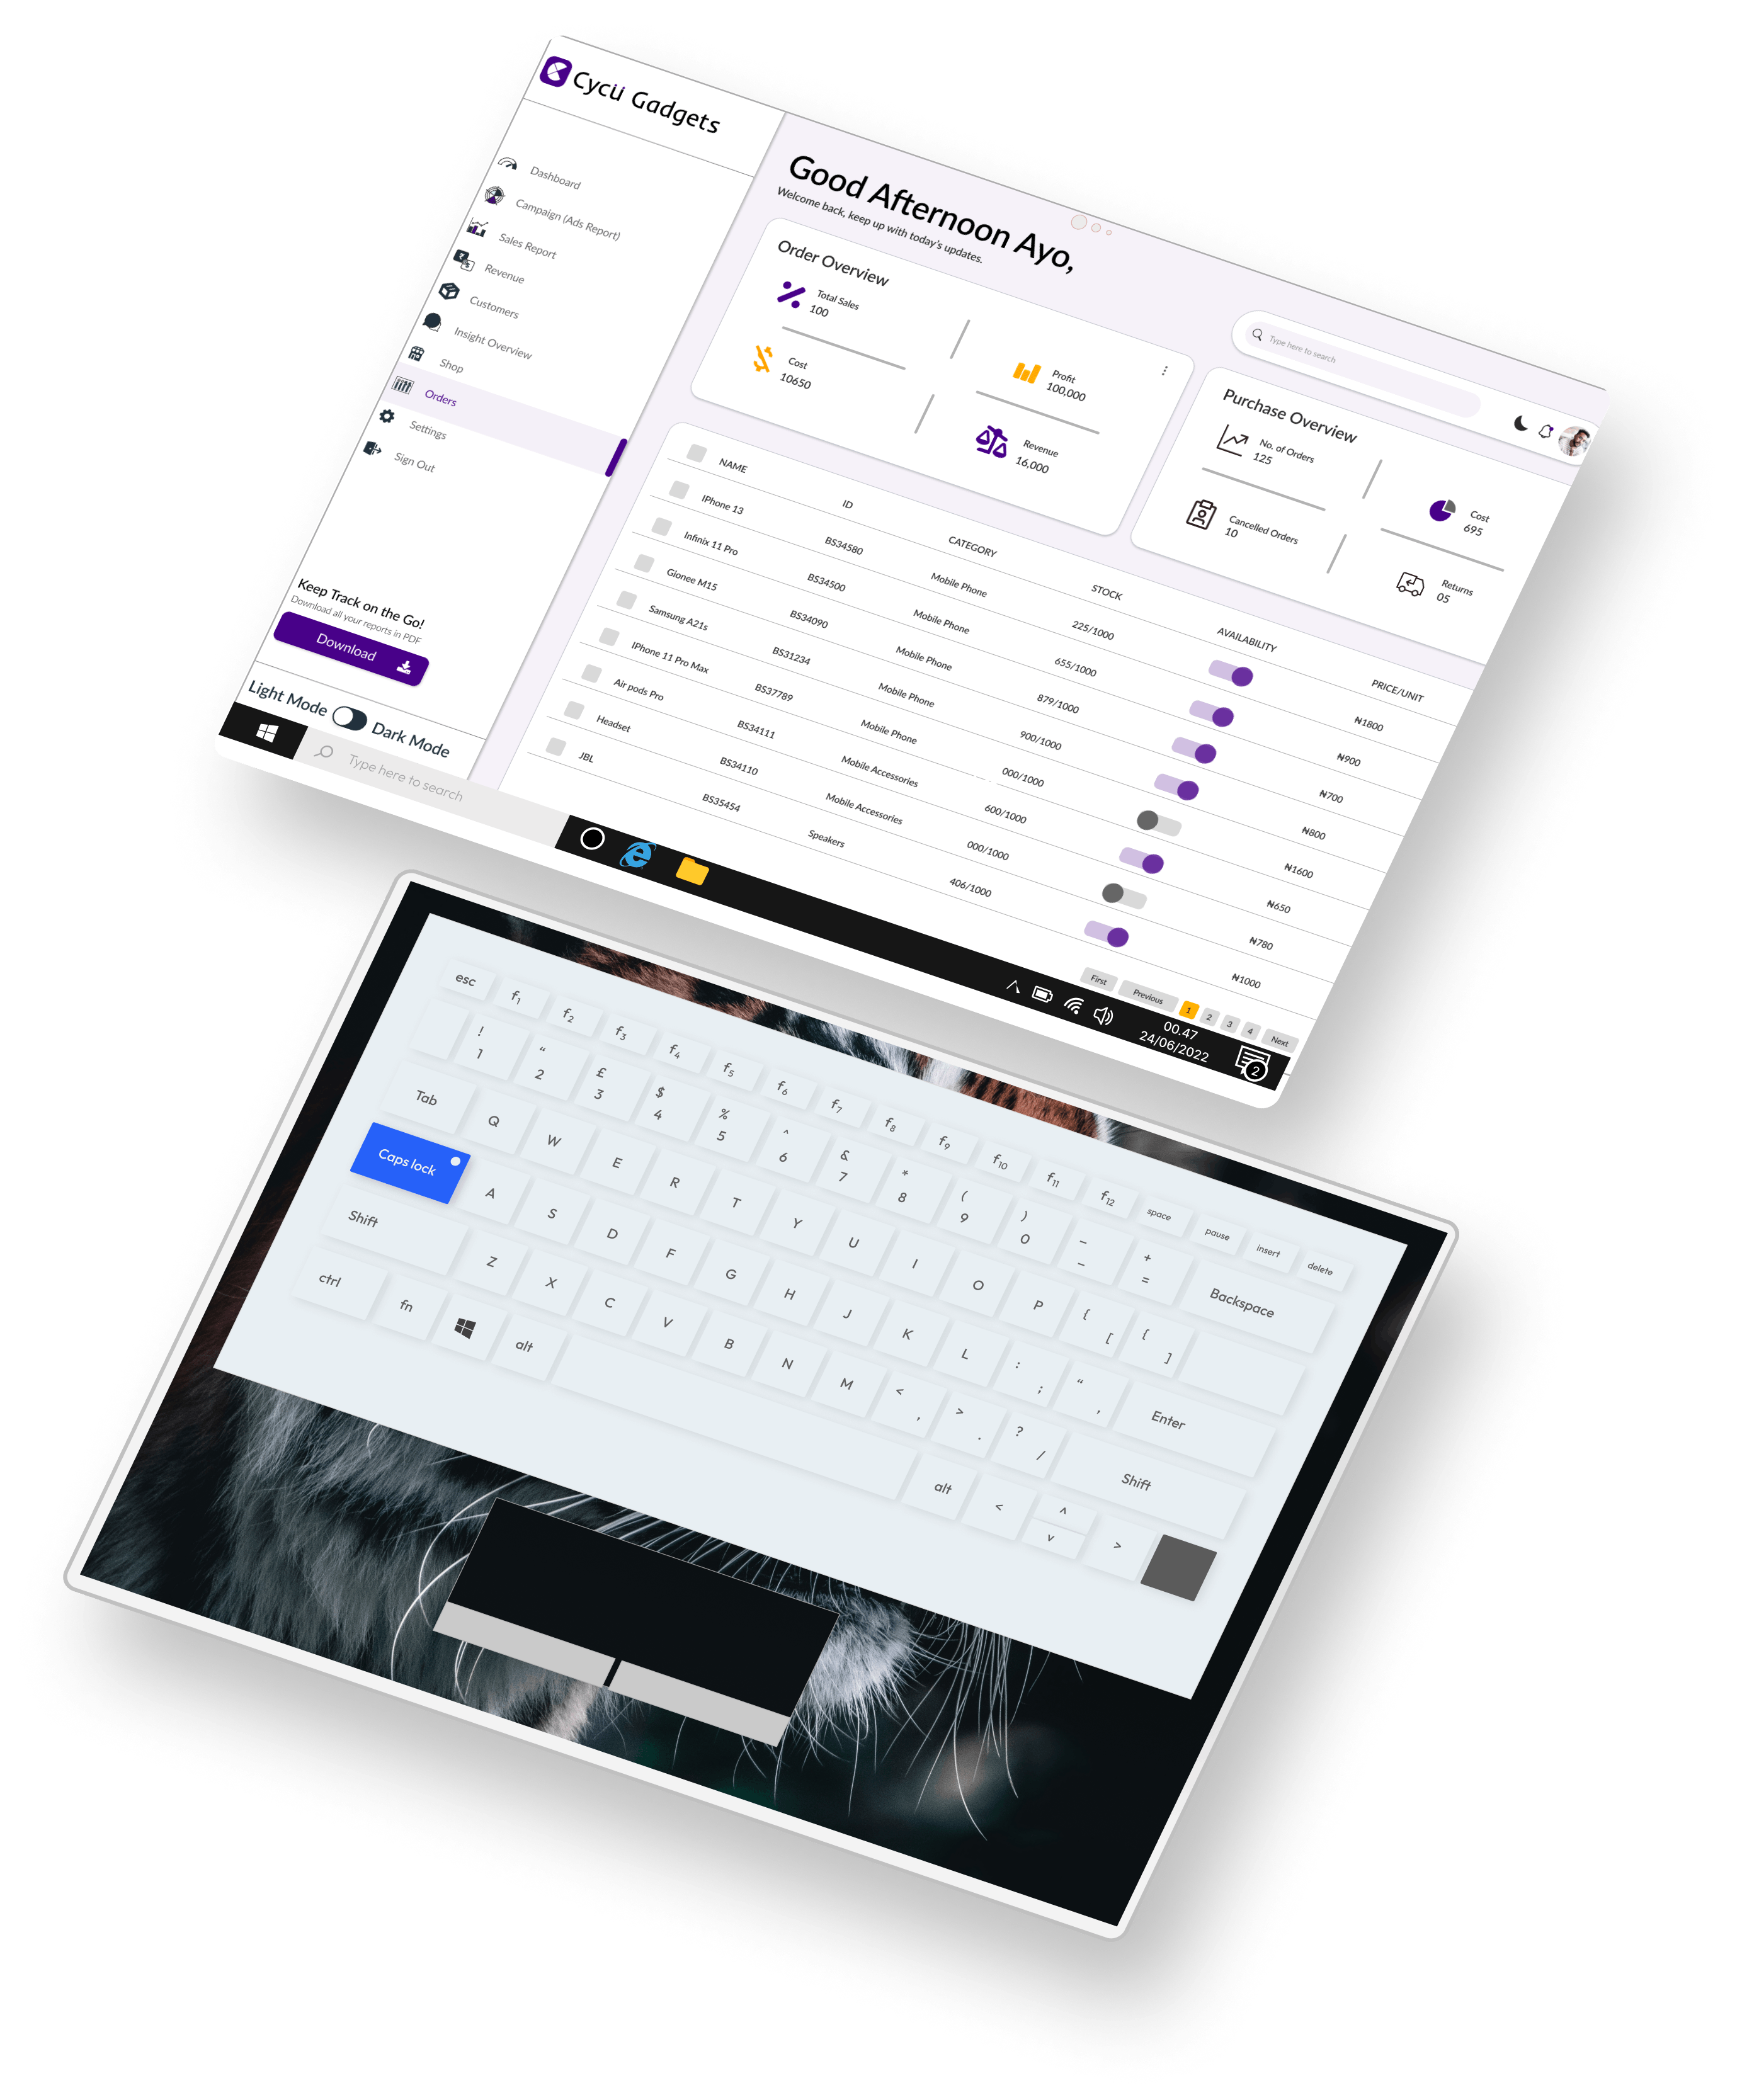
ORDER PAGE
The order page UI displays the list of orders placed by customers. This allows the business owner to track the list of orders that has been placed by customers and keep track of them.
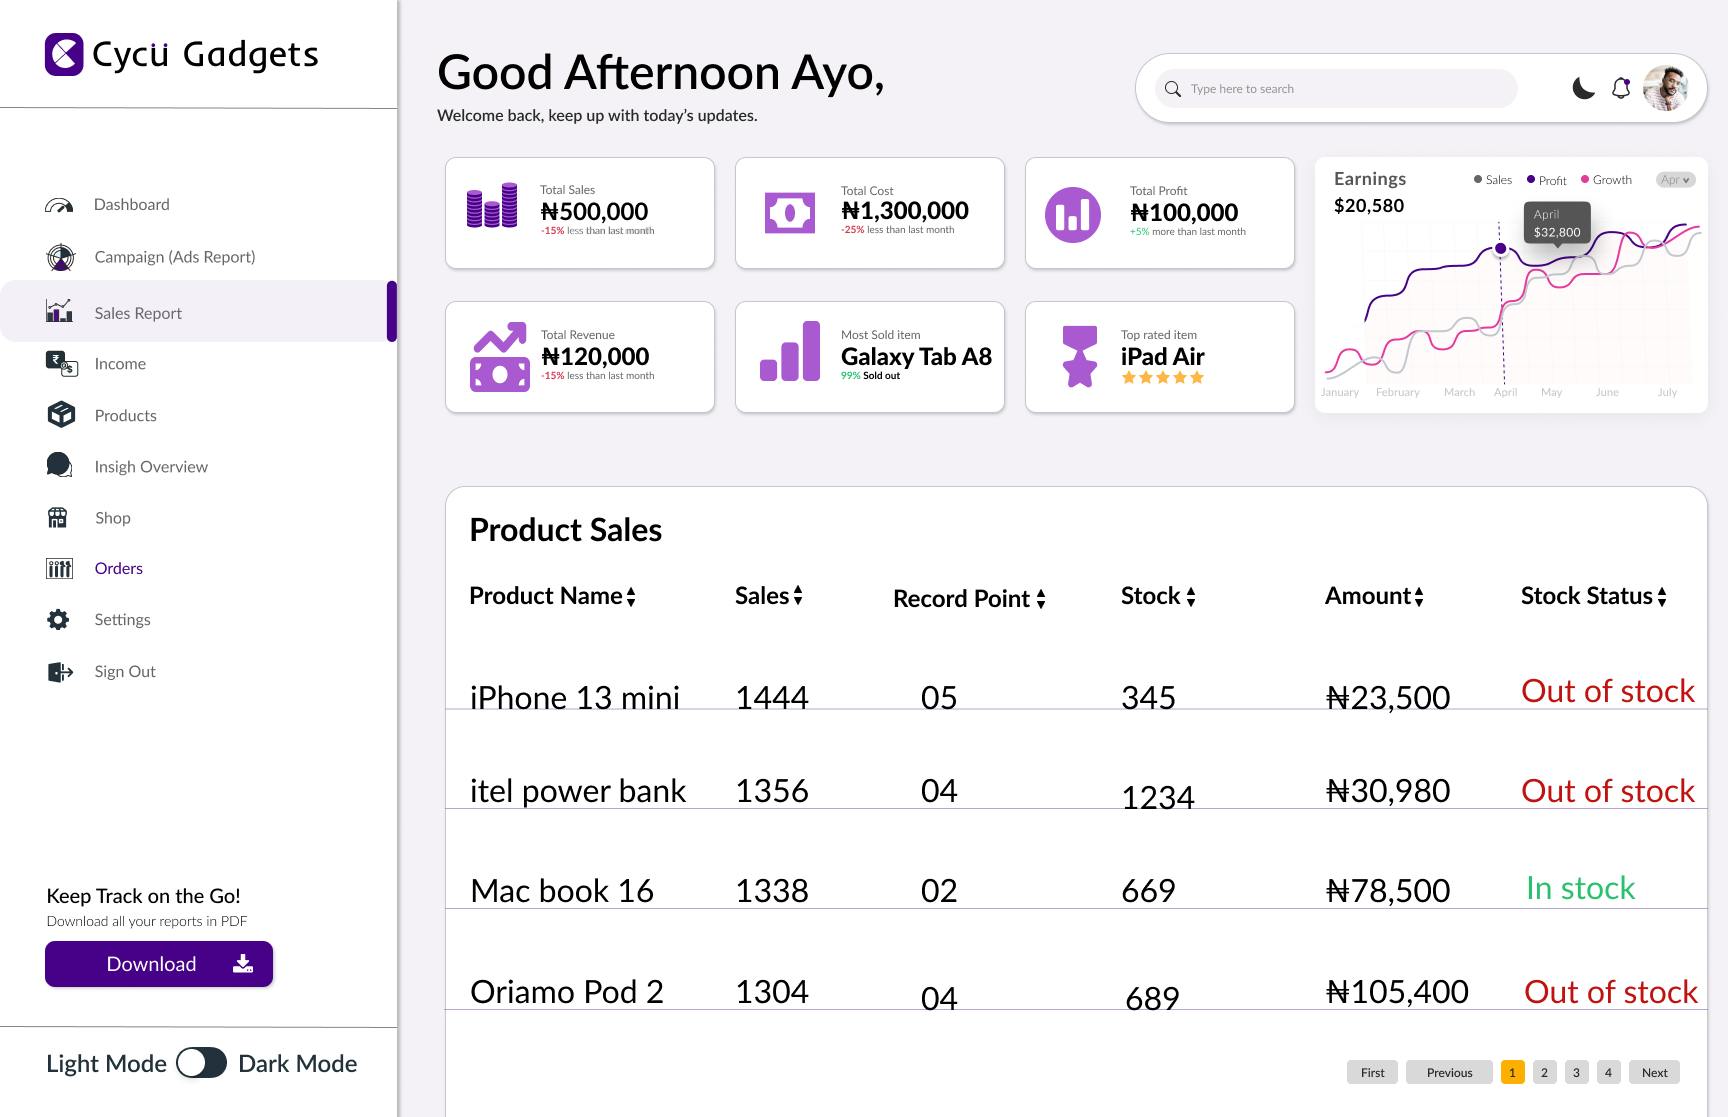
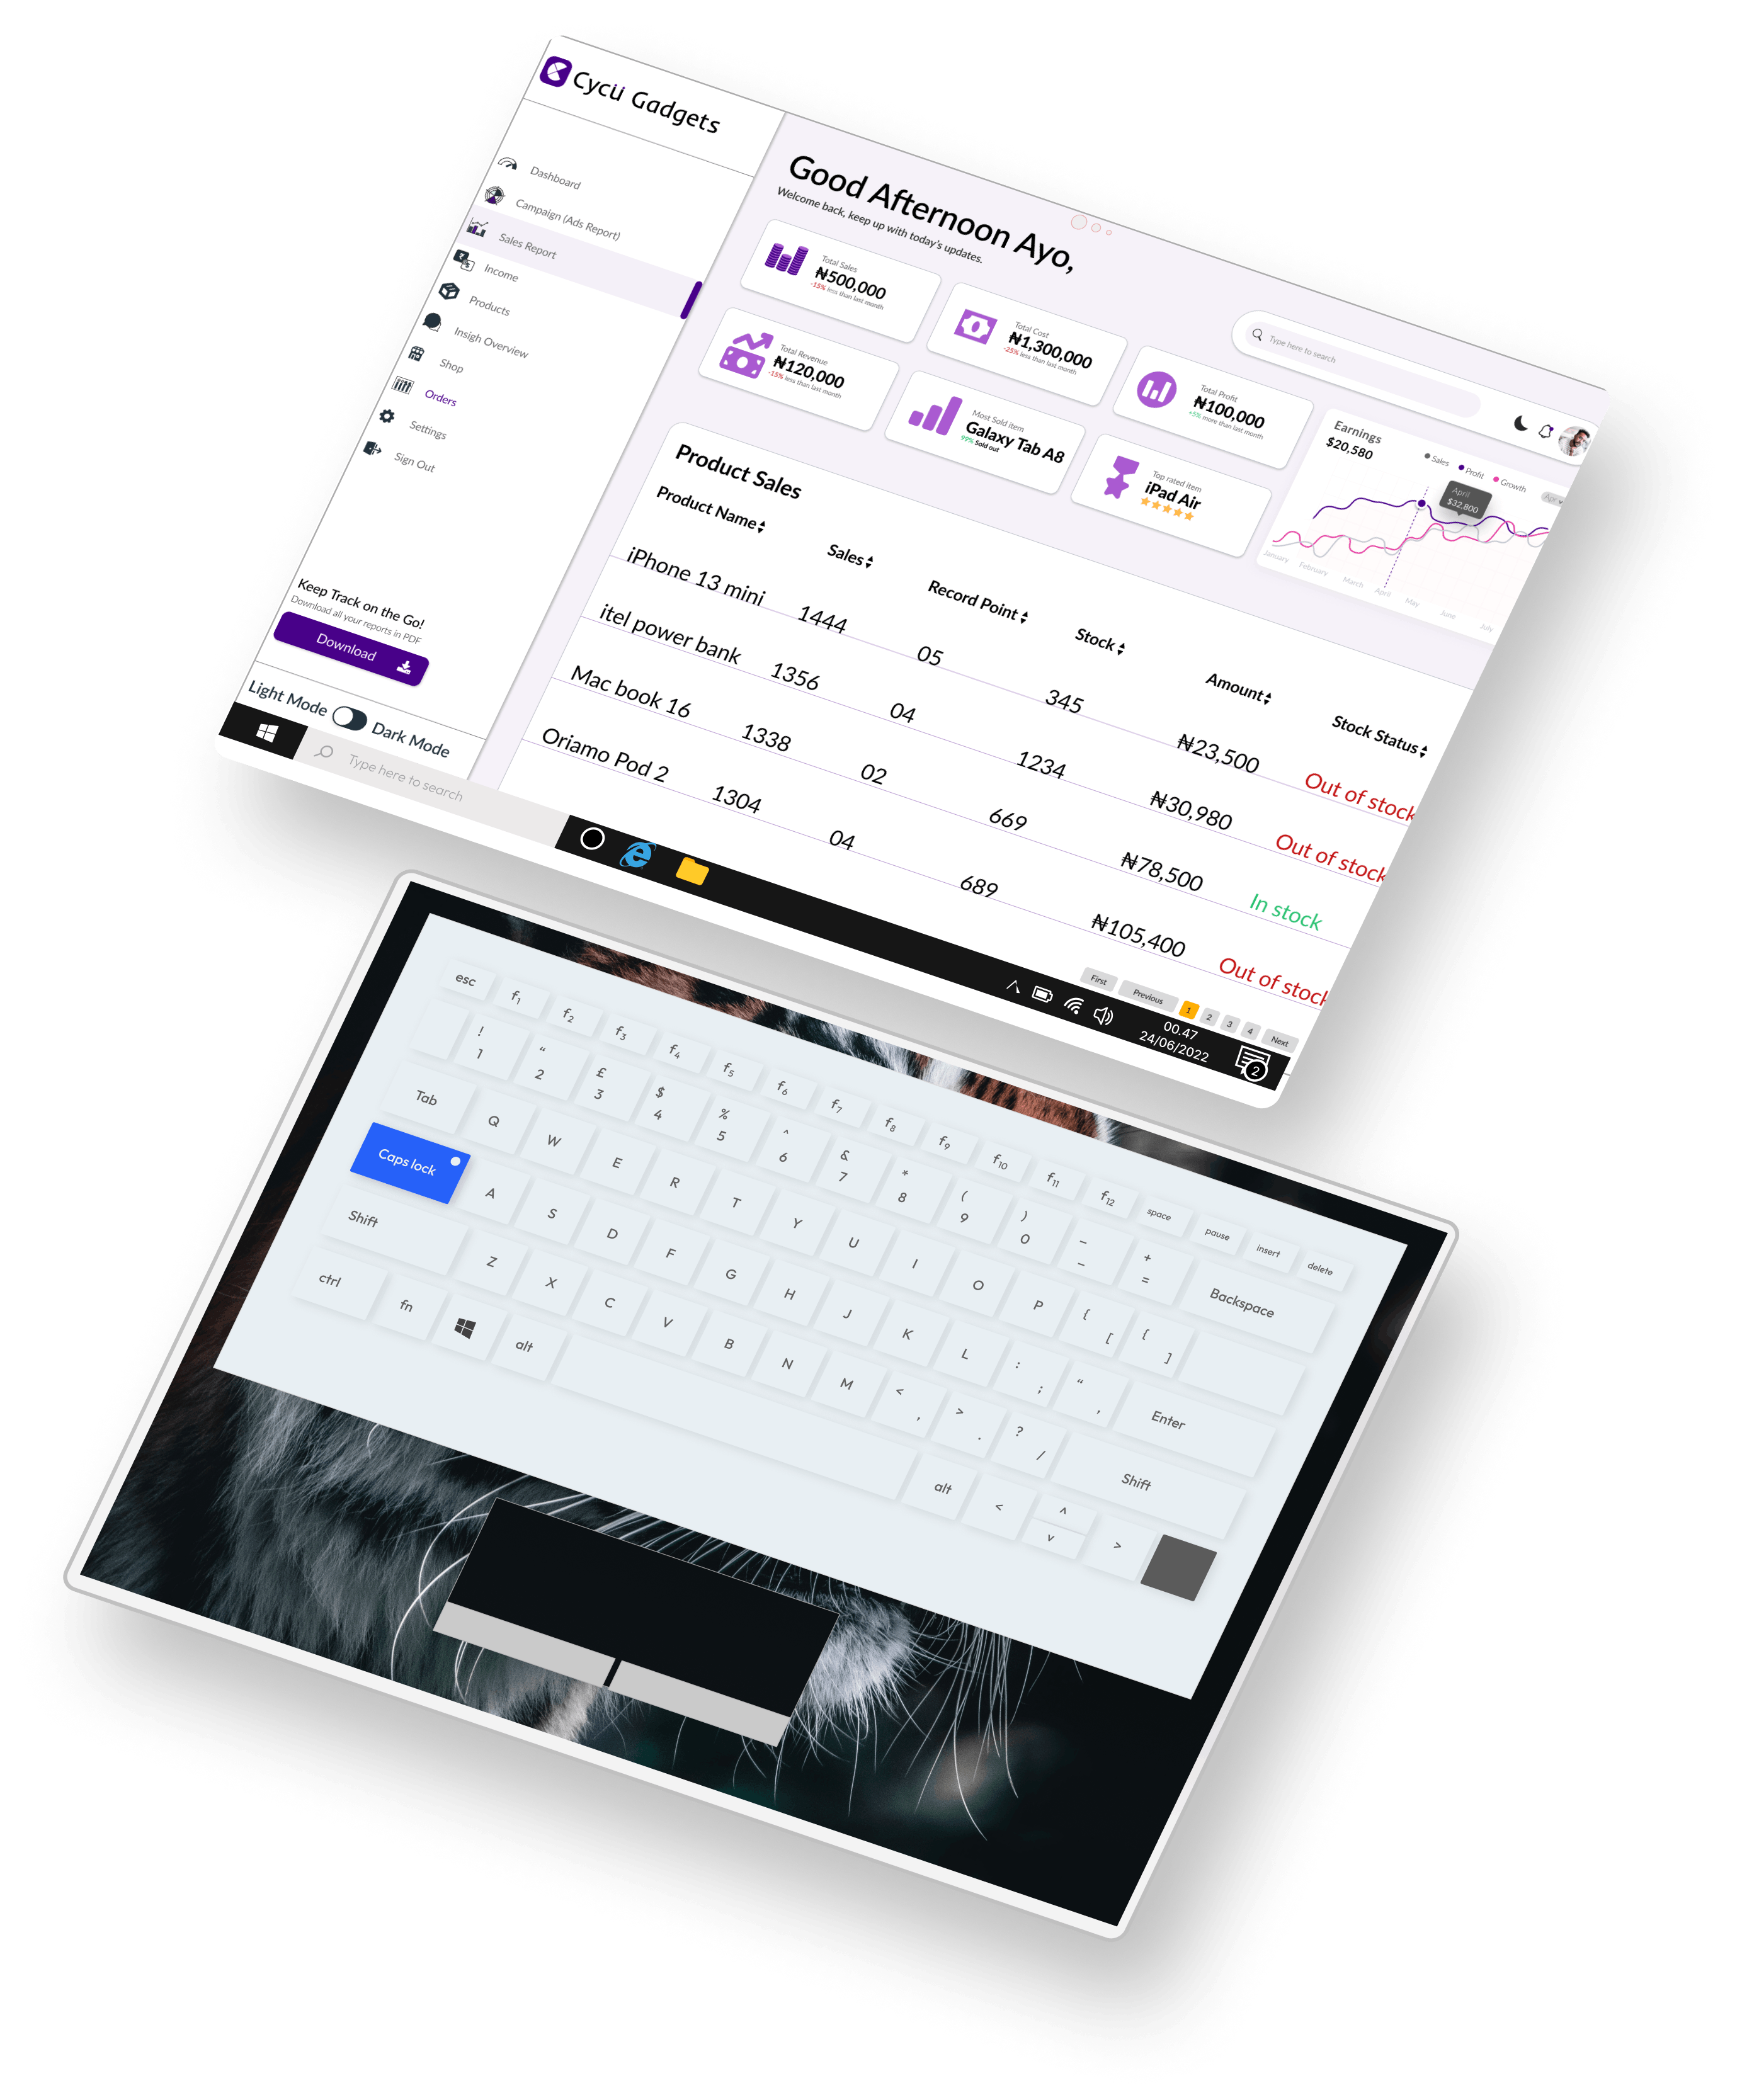
SALES REPORT PAGE
The sales report page UI displays a lot of information. This includes all the products sold on the website, the product name, and their prices. The total sales, total costs, total profit, total revenue, most sold item and most rated item. This gives the business owner an insight into the growth of the business over time. A graph of earnings showing a trend of sales, profit and growth over the months is also included.
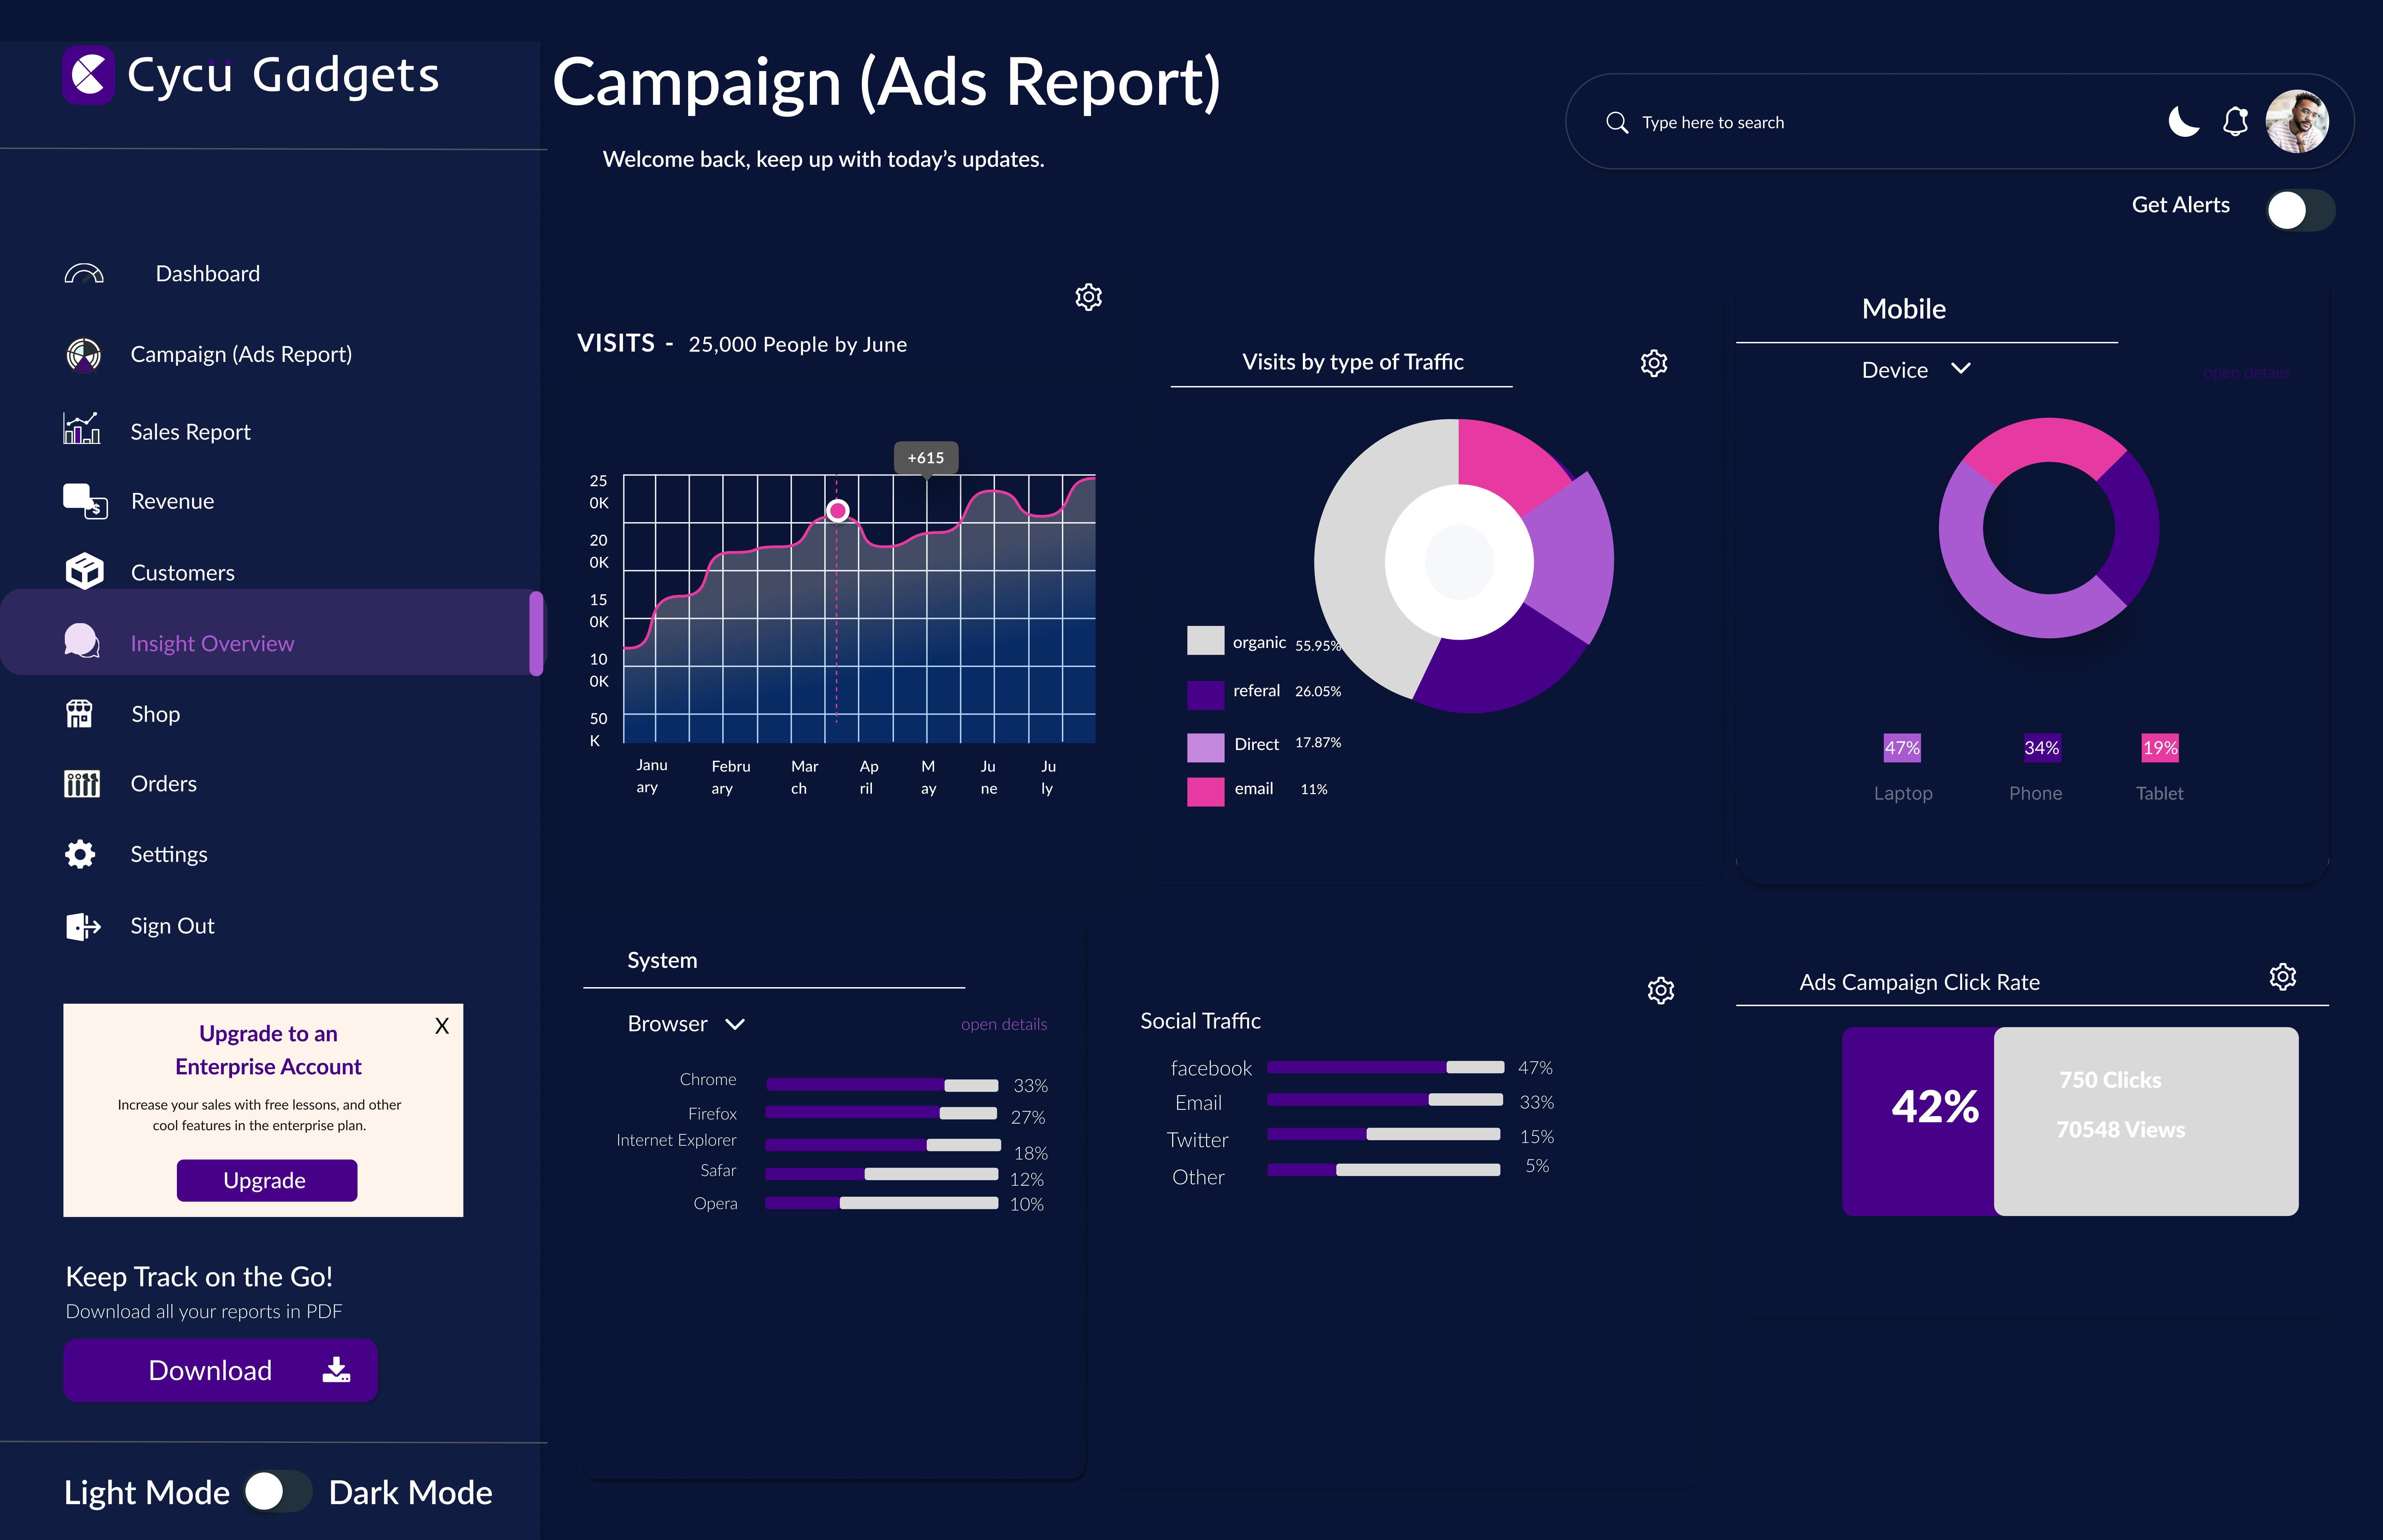
CAMPAIGN ADS REPORT PAGE
The campaign ads page is meant to show the business owner the performance of the ads ran, this shows traffic and the types of traffic generated, the devices used, ad campaign click rate and social traffic.
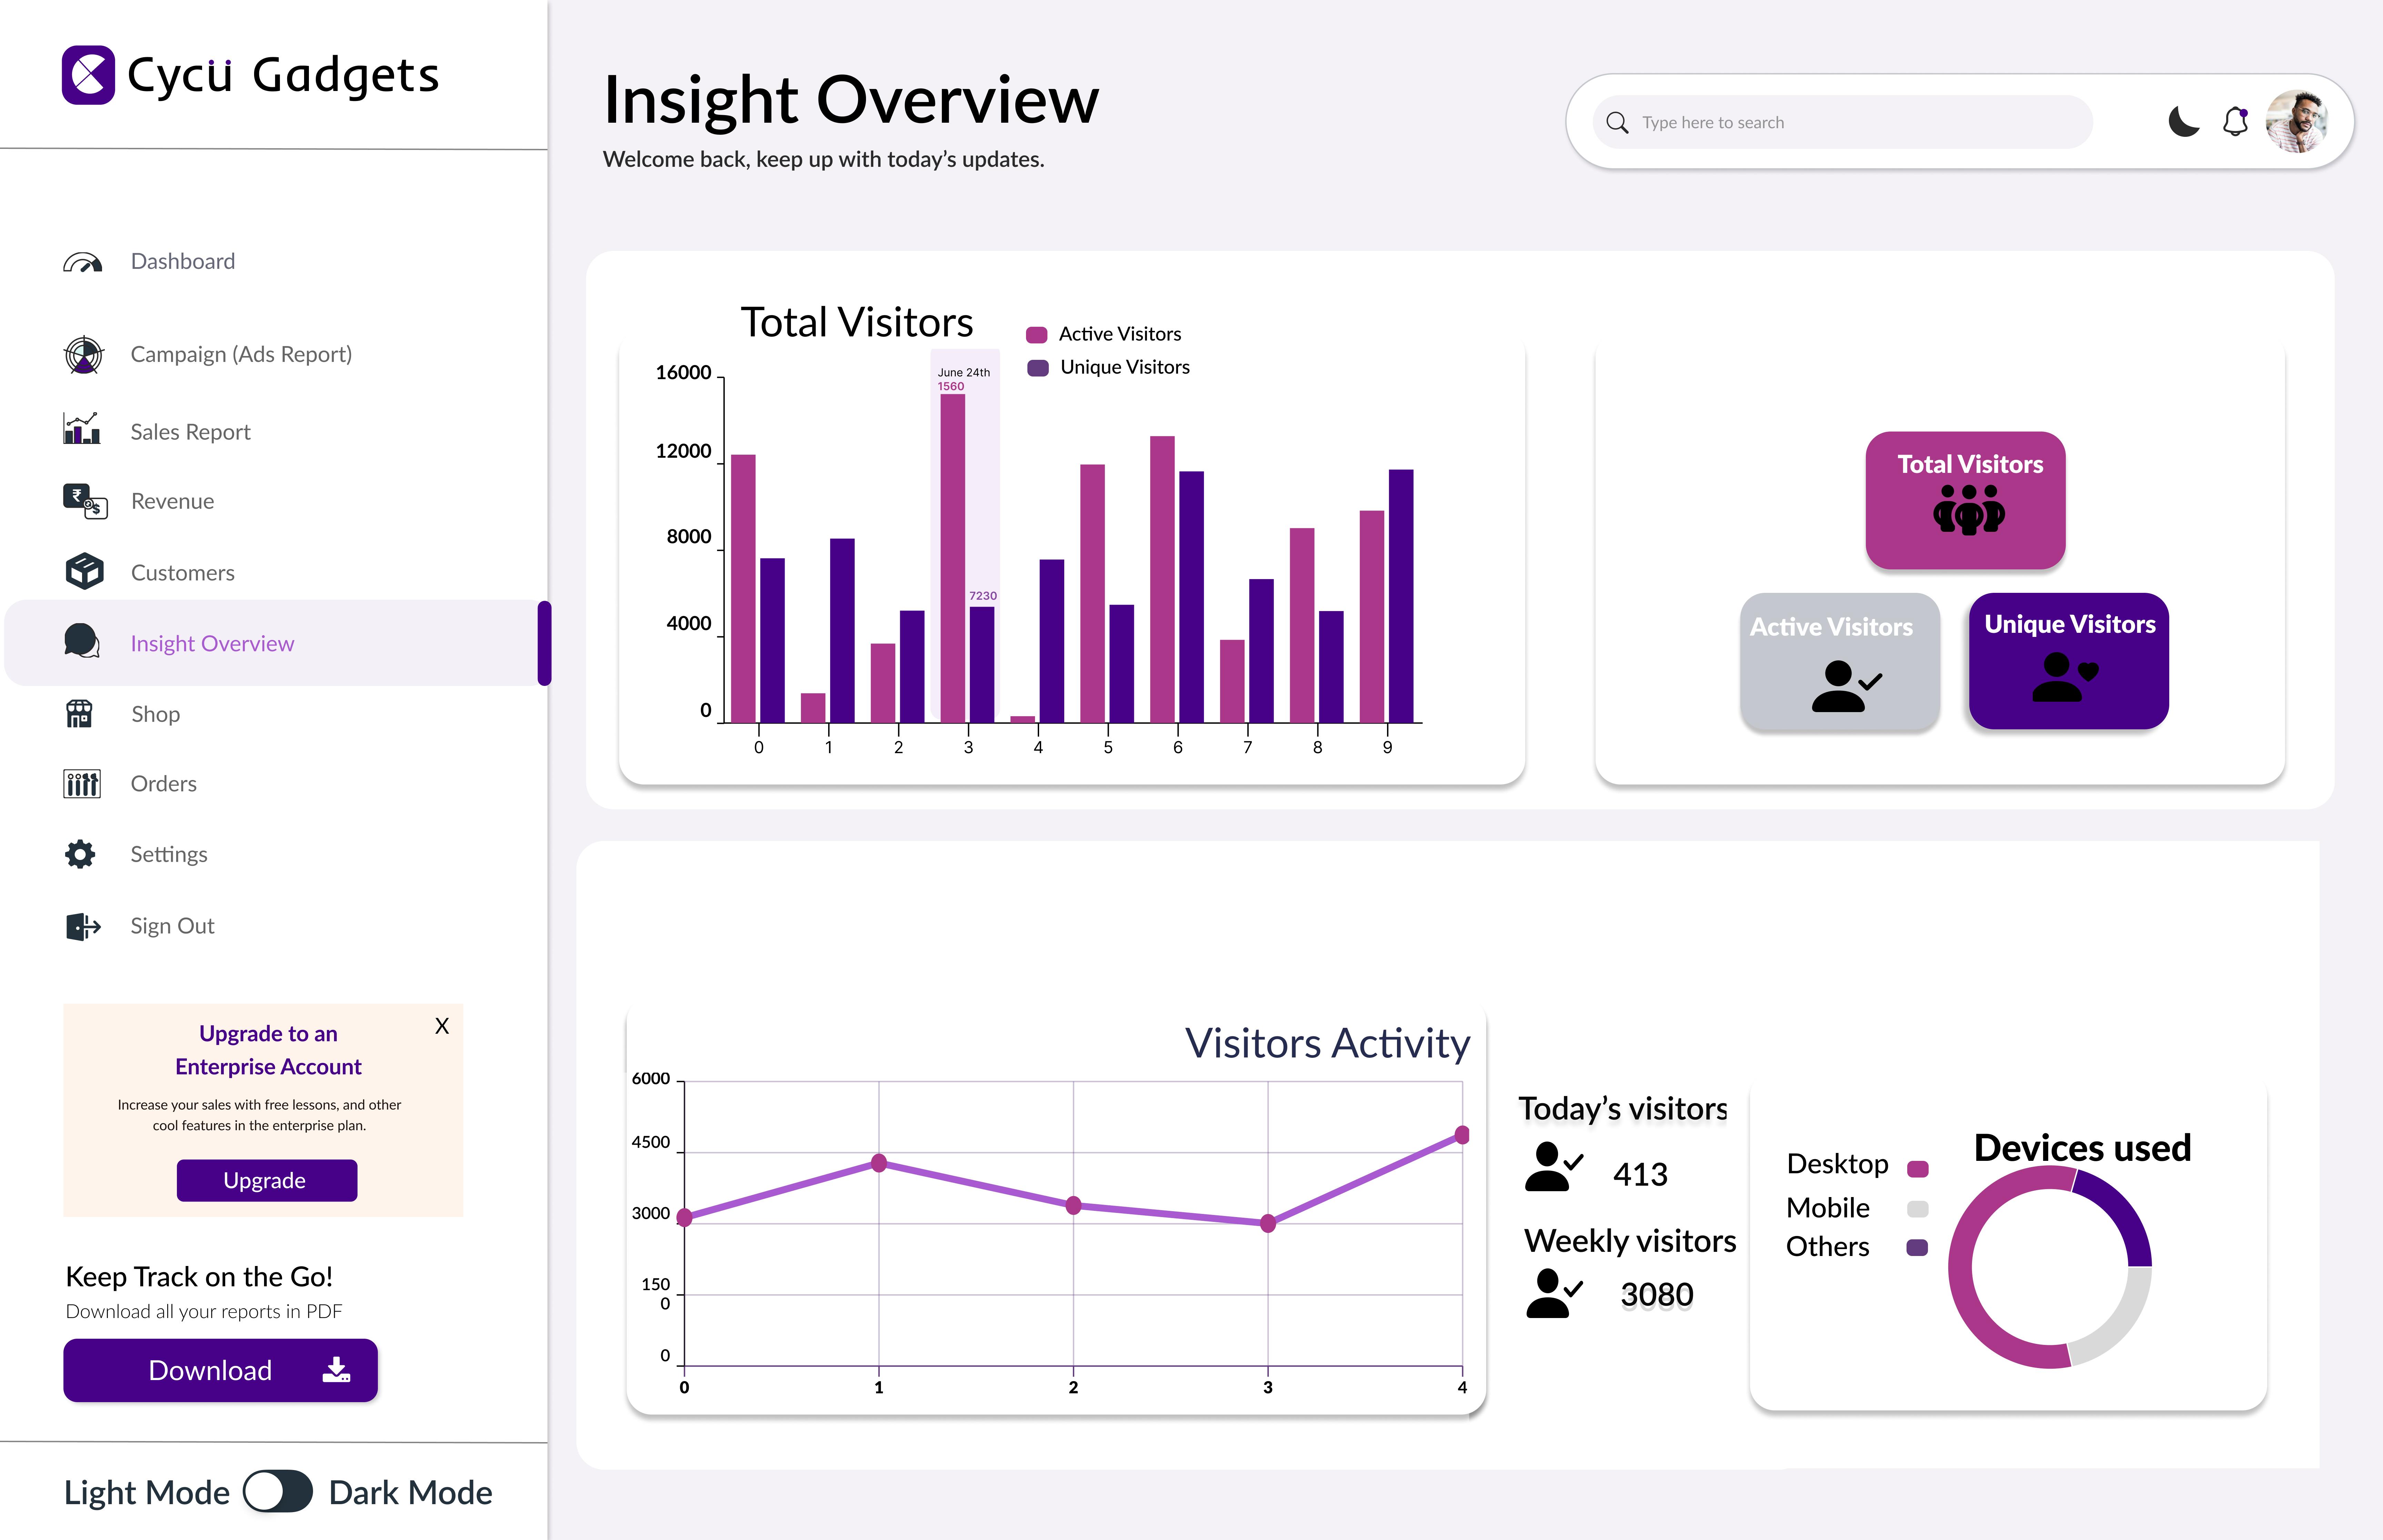
INSIGHT OVERVIEW PAGE
The insight overview page gives a better understanding of what is happening in the business. It shows us the demography of visitors, the age breakdown, the gender, total visitors and unique visitors over time.
MOCKUPS
We worked on Sketch for the UI design and passing the high fidelity mockups to our UI designers once the content was mostly finalized and the wireframes had been approved by all team members. All mockups followed our Sketch libraries.